Interseismic strain accumulation on the Southern San Andreas fault
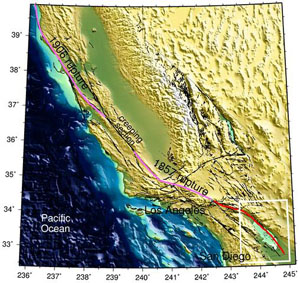
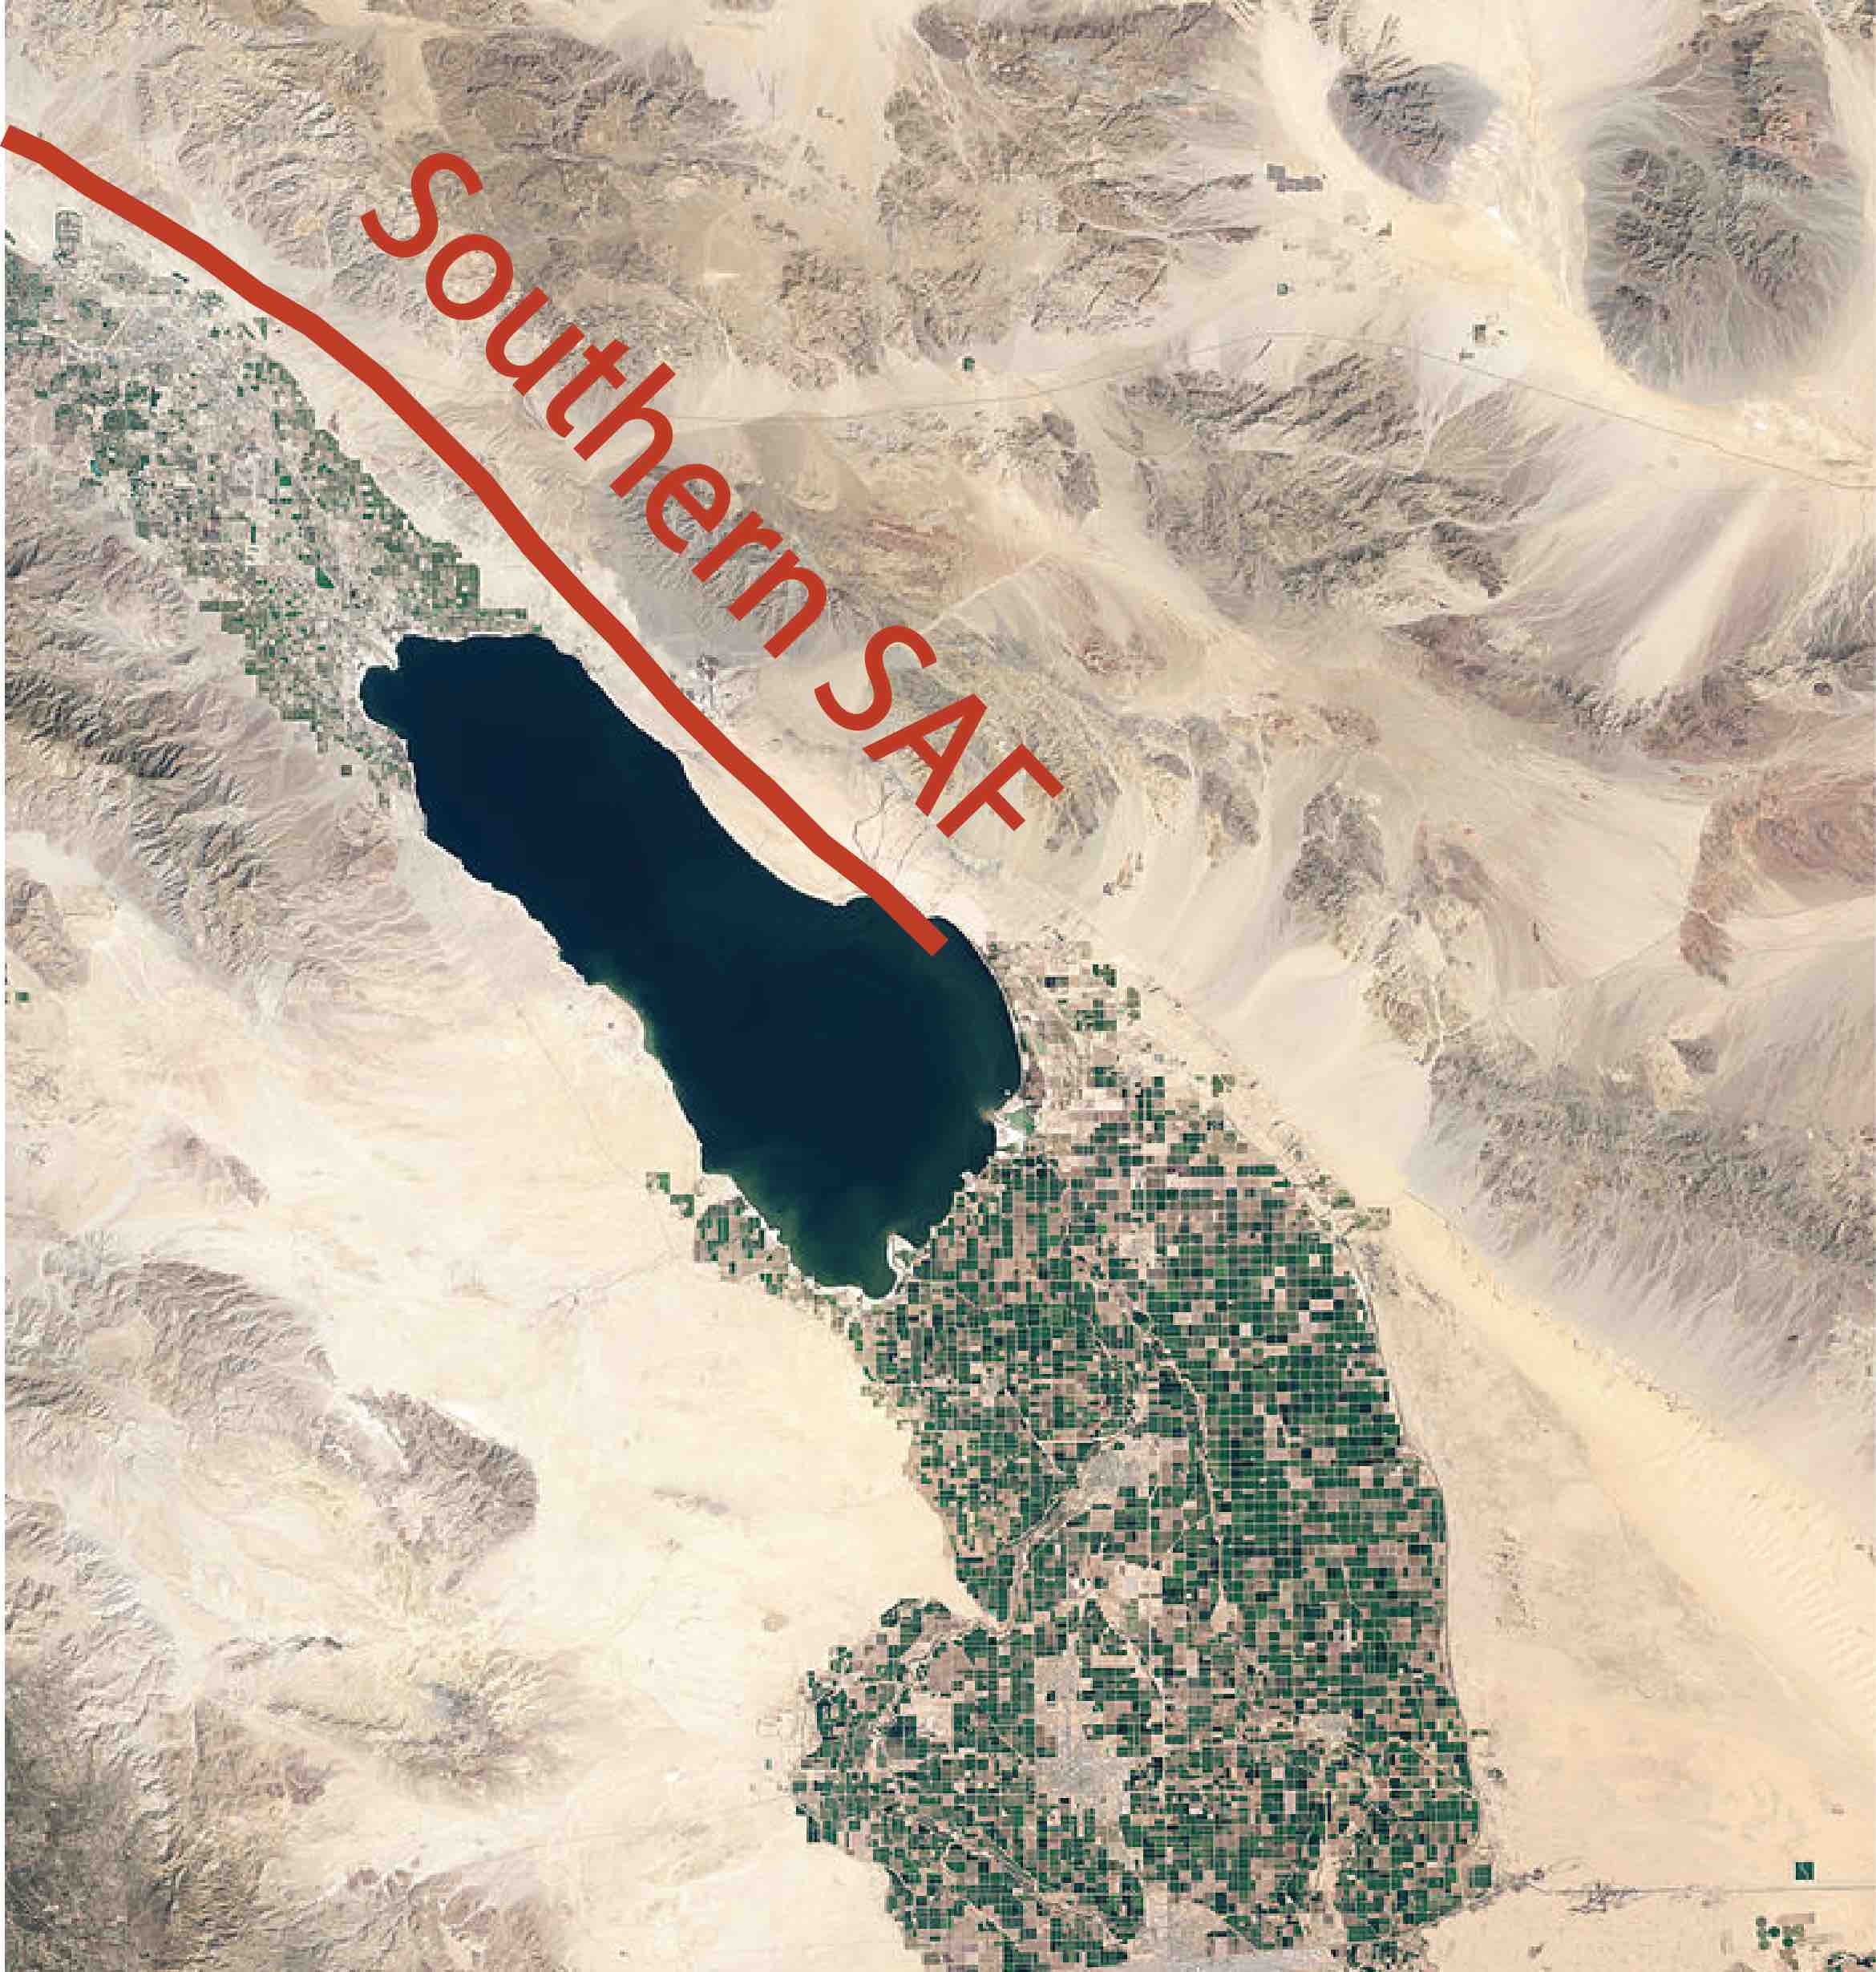
The San Andreas fault (SAF) in California is a mature continental transform fault that accommodates a significant fraction of motion between the North American and Pacific Plates. The two most recent great earthquakes on the SAF ruptured its northern and central sections in 1906 and 1857, respectively (see pink lines in the shaded topography map). However, the southern section of the fault has not produced a great earthquake in historic times (over more than 300 years). The unbroken segment of the SAF is shown by a red line in figures below.
|
|
Because this part of the SAF has been known to creep (at least near the surface), an important question is the extent of fault creep, and whether creep releases a significant fraction of interseismic stress build-up on a fault. To address these questions, I used SAR data collected by the ERS-1 and ERS-2 satellites of the European Space Agency to investigate the slow tectonic deformation due to the southern San Andreas fault system. Results indicate that the San Andreas fault is accumulating significant elastic strain corresponding to a slip rate of about 25 millimeters per year. Given the fault quiescence of about 300 years, the inferred amount of slip deficit on the southern SAF is 6-8 meters, comparable to the maximum interseismic slip deficit, as well as coseismic offset ever documented on the fault by paleoseismologic studies. I also find a surprisingly robust strain accumulation on the southern San Jacinto fault to the west of San Andreas. The inferred slip rate on the San Jacinto fault is about 20 millimeters per year, almost twice the previously believed value. Another surprising feature of interseismic deformation on the San Andreas fault system is a pronounced asymmetry in strain rate with respect to the mapped fault traces. Deformation appears to be localized on the eastern side of both the San Andreas and San Jacinto faults, possibly due to a more rigid crust on the opposite fault side.
Perspective view of the satellite line-of-sight velocities (color) due to horizontal motion between the North American and Pacific places
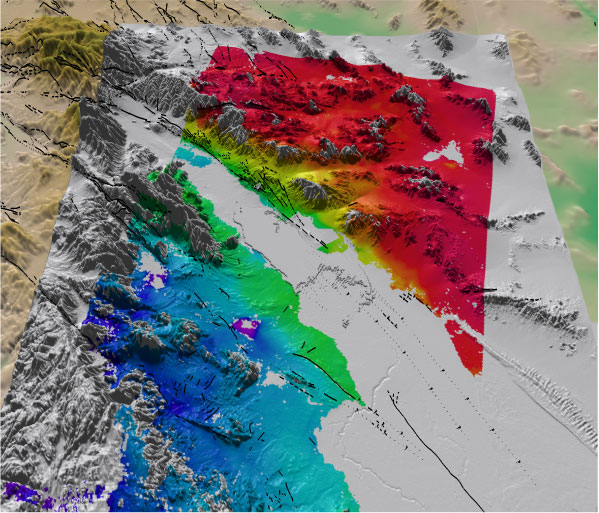
Surface deformation inferred from a stack of 35 radar interferograms spanning a 200-km long and 100-km wide swath across the Salton Sea area. Colors denote the satellite line-of-sight velocity, and black wavy lines denote active faults. Line-of-sight velocities are draped on top of digital terrain model provided by the Space Shuttle Radar Topography Mission (SRTM).
Stacked line-of-sight velocities (GRD file, 3 Mb): geo_SSAF_T356.grd
Finite element model of interseismic deformation and stress accumulation on a strike slip fault:
Ground shaking (surface velocity) due to a hypothesised future rupture of the southern San Andreas fault:
MPEG movie (15 Mb)
(simulation and animation courtesy of SDSU, UCSD, and San Diego Supercomputing Center)